2021 Reassessment Model Report: Condominium Properties in West Chicago
Cook County Assessor’s Office
West Chicago is one of Chicago’s 8 assessment townships to be reassessed this year. It has 25 residential assessment neighborhoods containing approximately 36,500 Class 2 condominium units.
This report contains detailed reporting about the West Chicago real estate market and a self-study of assessments produced at the modeling stage of assessments.

Assessor’s Summary
Chicago’s real estate market is thriving.
Property values throughout the City have generally remained steady, or increased, since Chicago’s last reassessment in 2018. In West Chicago, the median sale price of a condominium property was about $390,000 in 2018 and $410,000 in 2020. This is a change of $20,000, or 5%. Note that each individual home’s 2021 assessment may go up or down by varying percentages, because every home is different.
In 2021, our job is to produce estimated values of all homes. At the initial stage of this job, our median estimated value of West Chicago condominium properties was $350,000.
West Chicago 2021: Condominium Sale Prices & Estimated Values
| 2020 sale prices (condos that sold) | Assessor’s Office’s 2021 estimated values (all condos) | |
|---|---|---|
| Median | $410,000 | $350,000 |
| Bottom and Top Third (33rd and 66th percentiles) | $350,000 - $480,000 | $300,000 - $400,000 |
Assessment equity improved in the 2021 model compared to 2018.
We tested our model’s estimated prices against actual sale prices using standards like those used by the International Association of Assessing Officers and Illinois Department of Revenue. In the 2021 reassessment of West Chicago the CCAO met 3 of 3 standards for high-quality assessment. Read more in the “Assessment Equity” and “Appendix” sections.
Increases in property values don’t necessarily cause the same increases in tax bills.
The Assessor does not set property tax levies, rates, or bills. But your property’s share of the total assessed value of all Chicago properties affects its share of Chicago’s property taxes. Your property’s share will depend on 2021 reassessments throughout Chicago, from homes in Chatham and Jefferson Park to commercial properties in Little Village and the Loop.
This means your home’s value can increase, while its share of property taxes could increase, decrease, or stay the same due to Chicago’s reassessment. If other properties’ assessments increase more than yours, this can shrink your home’s share of property taxes.
The 2021 reassessment will affect the property tax bill issued in the summer of 2022. Your property tax bills also list the taxing districts funded by your property taxes.
Market Report
The Assessor’s Office used 7 years of sales throughout Chicago, from 2013 through the end of 2020, to estimate home values in 2021. Below, we show data about these real estate market changes in West Chicago.
Median Sale Prices
Below we show year-over-year sale prices of condos in West Chicago. The median sale price is shown in dark green, with the light green band showing the bottom and top thirds of the market.

In 2020 – the most recent full year of data we can access – the median sale price of a West Chicago condominium was about $410,000, with the lower third of sale prices around $350,000 and the top third around $480,000.
Sale volume
In 2020, there were 1,725 sales of condominium homes in West Chicago.

2020 Sale Prices throughout West Chicago Township
Here’s how sale prices in 2020 varied throughout West Chicago.

You can read more about sales in West Chicago, find neighborhood-level information, and read more about how COVID-19 affected the real estate market in the Appendix at the end of this report.
Note that these are average sales trends in West Chicago. To calculate assessments, we use data from 7 years of sales throughout Chicago. More details about this are in the next section.
Fun facts
- The top sale price for a condominium property in West Chicago in 2020 was $1,570,000.
Model & Results
How does the model know what my home is worth?
“The model” is a computerized statistical model that uses real estate market data to estimate the value of homes that haven’t sold. These models are often called Automated Valuation Models, and are the standard for conducting computer-assisted mass appraisal.
The goal of the model is to answer this question: “What would the sale price of every home be if it had sold recently in an arms-length transaction?”
To answer this question, we use a two-step process:
Modeling. First, we use computer code to analyze data about condo sales. Any two condos may have different characteristics (location, age, etc.) and sale prices. But there are consistent patterns in how characteristics affect sale prices on average. It’s important to detect these patterns accurately. To do that, we use computer code to train a predictive machine learning model, which learns to recognize complex patterns much faster than a human could. The output of this step is a model which can be used to predict any home’s sale price based on its characteristics and these learned patterns.
Valuation. We then use the model created in Step 1 to predict values for all condos. These predicted values are the scope of this report, but these values are subject to change. Estimated values produced by the model are reviewed by software and by our expert analysts, who review assessed value changes by neighborhood and property class and make adjustments as necessary.
Mailing. Finally, we mail Reassessment Notices to homeowners with their property’s estimated market value, its characteristics, and its assessed value.
Note about condos:
The Cook County Assessor’s Office does not track characteristic data for condominiums. Like most assessors nationwide, our office cannot enter buildings to observe property characteristics. For condos, this means we cannot observe unit square footage, amenities, quality, or any other interior characteristics.
Because of this, unlike single-family and multi-family homes, the only information the Assessor’s Office has about individual condominium units is their age, location, sale date/price, and percentage of ownership. This makes modeling condos particularly challenging, as the number of usable features is quite small. Fortunately, condos have two qualities which make modeling a bit easier:
Condos are more homogeneous than single- and multi-family properties.
Condo are pre-grouped into clusters of like units (buildings), and units within the same building usually have similar sale prices.
For the 2021 reassessment of the City of Chicago, we used around 504,000 sales from the last 7 years to train the model so that our model could detect all related patterns between characteristics and sale price, and so that our estimated home values were as accurate as possible. We used a variety of location characteristics (like school district, whether a property is close to a road, and assessor neighborhood code) and others (like flood risk and median income of the surrounding area).
You can learn more about our modeling process here:
Model Performance: Estimated Market Values
The job of the Assessor’s Office is to estimate market values of all homes, such that estimates are an accurate and unbiased reflection of the market.
The map below shows averages of our model’s estimated 2021 values of all homes throughout West Chicago Township:

Average increases in estimated values
The map below shows how values for condominium properties have changed, on average, from last year’s final values to this year’s 2021 model values.
Note that:
Every individual property might have experienced a different increase or decrease in estimated value.
Individual values are subject to change after modeling before they are mailed to taxpayers, during analyst review.
Increases in assessments don’t necessarily cause increases in tax bills (see the next section).

Stats: 2018 vs 2021 model
Under Assessor Kaegi’s leadership, the CCAO is committed to measuring its assessment quality using sales ratio studies, in accordance with the standards for high-quality assessment set by the International Association of Assessing Officers (IAAO). The Illinois Department of Revenue (IDOR) uses similar methods to conduct sales ratio studies.
Ratio studies compare estimated values to actual sale prices, for properties that have sold. Sales ratios are calculated as the ratio between a property’s estimated value and its actual recent sale price.
Sales Ratio = \(\frac{Market Value Estimate}{Actual Recent Sale Price}\)
A sales ratio of 1.0 means that a property’s value was estimated to be precisely its sale price. A ratio of 0.9 indicates the estimated value was 90% of its sale price. Studies of sales ratios of many properties can be used to measure assessment accuracy.
Below, we conduct an evaluation of assessment quality in 2018 (at the end of the assessment cycle, after reassessment, appeals with the Assessor’s Office, and appeals with the Cook County Board of Review) vs. 2021 (modeling phase) by comparing estimated values to sale prices of homes that recently transacted in the year before the reassessment.
West Chicago Real Estate Changes:
First, let’s look at the real estate market has changed in West Chicago. To do this, we can look at more than just median sale price of a home. We can slice home sales into three groups: the bottom third of sale prices, the middle third of sale prices (which includes the median), and the top third.
| Year | Market Subset | Typical Sale Price |
|---|---|---|
| 2017 | Bottom third | $240,000 |
| 2017 | Median | $370,000 |
| 2017 | Top third | $530,000 |
| 2020 | Bottom third | $270,000 |
| 2020 | Median | $410,000 |
| 2020 | Top third | $580,000 |
West Chicago Ratio Study Results
Sales ratios also measure assessment equity, because ratios should be the same regardless of the value of the property.
The below graphs show sales ratios in 2018 and 2021 for the bottom third, middle third, and top third of condominium sale prices. Ratios should be near 1 for all three segments of the market.

One way to analyze assessment equity is to measure whether there were improvements in assessment accuracy for the bottom third of homes in West Chicago.
In the 2018 assessment, on average, a hypothetical condo in the bottom third of the market that recently sold for $240,000 could have been assessed with a ratio of 0.96, as if it was worth $230,400 (a difference of -4%).
In the 2021 assessment, on average, a hypothetical condo in the bottom third of the market that recently sold for $270,000 could have been assessed with a ratio of 1.04, as if it was worth $280,800 (a difference of 4%).
Sales ratios can be analyzed in different ways to measure assessment uniformity and equity. In the 2021 reassessment of West Chicago the CCAO met 3 of 3 standards for high-quality assessment, using sales ratio metrics determined by the IAAO. (Read more in the Appendix.)
Property Taxes and Appeals
How will the reassessment affect my property tax bills?
It is not yet known, because tax bills are affected by taxing agencies’ funding needs and by all assessments in Chicago, which will continue throughout this year.
The Assessor does not set property tax levies, rates, or bills. But your property’s share of the total assessed value of all Chicago properties affects its share of Chicago’s property taxes. Your property’s share will depend on 2021 reassessments throughout Chicago, from homes in Chatham and Jefferson Park to commercial properties in Little Village and the Loop.
This means your home’s value can increase, while its share of property taxes could increase, decrease, or stay the same due to Chicago’s reassessment. If other properties’ assessments increase more than yours, this can shrink your home’s share of property taxes.
West Chicago Township is just one of Chicago’s 8 townships being reassessed this year. Below, we show each Chicago township’s percent share of Chicago’s total Assessed Value in 2018.
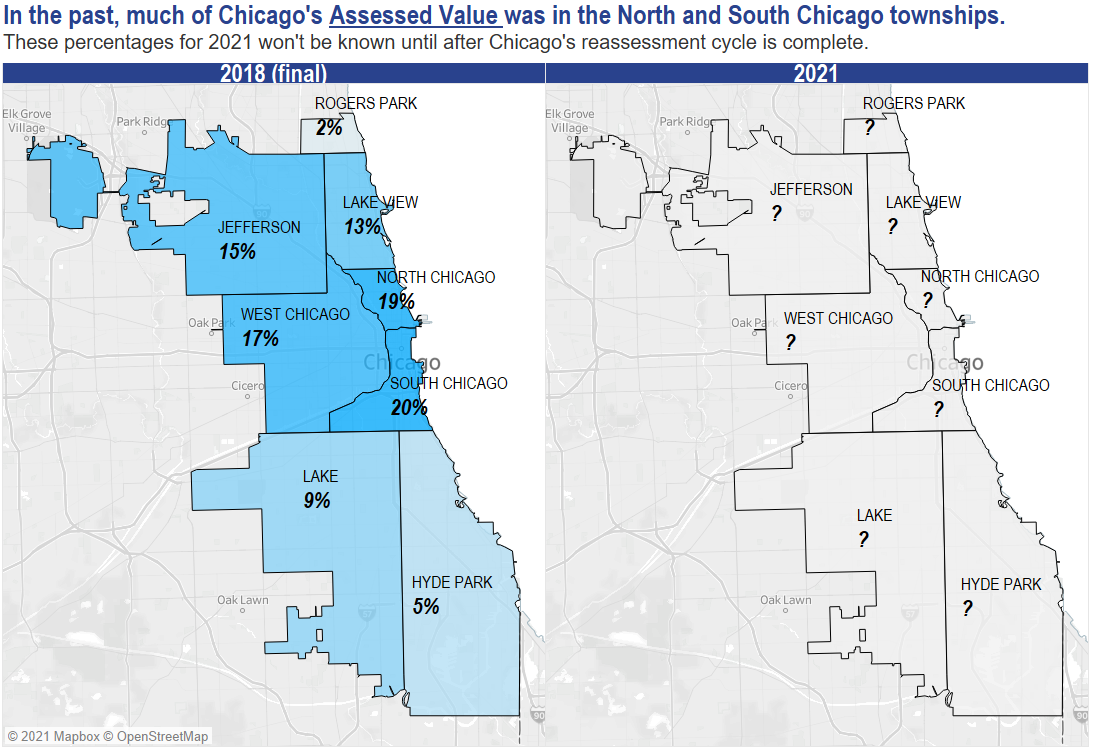
For 2021, each Township’s percent share of Chicago’s total AV – and, therefore, each Township’s percent share of Chicago property taxes – won’t be known until after the conclusion of the reassessment cycle for all of Chicago.
Property tax changes depend on assessment changes to all properties in the geographic boundaries (like Chicago) of your property’s taxing districts. It also depends on increased or decreased property tax dollars requested by taxing agencies. You can find your taxing districts listed on the property tax bills issued by the Cook County Treasurer.
The 2021 reassessment will affect the property tax bill issued in late 2022.
Neither the Assessor, nor the County or the City, receives more funding as a result of increased assessed values. The Assessor’s job, set by Illinois law, is to produce fair estimates of market value. Fair assessment of all properties helps to ensure that no property owner pays more or less than his or her fair share of property taxes. That’s why Assessor Kaegi’s goal is that all commercial, industrial, multifamily, and single-family property assessments fairly and accurately mirror the market. You can read more about the 2021 assessments of West Chicago multifamily and commercial properties here.
Should I file an appeal?
Property owners have the right to file an appeal complaint about their property’s assessment. In 2021, the CCAO is confident that, generally, these assessments are fair, accurate, uniform, and equitable. Because of this, we hope that most property owners will not have to file an appeal for an accurate assessment.
The best reason to file an appeal is to correct an error in our database about the characteristics of a home. Errors in our database about a home’s characteristics can affect our estimate of its value, even with an accurate model.
Learn more about appeals here.
Frequently asked question: I recently purchased my home. Why is your estimate of my home’s market value not the same as my purchase price?
A recent purchase price of a home can sometimes, but not always, match the Assessor’s Office’s estimate of its true market value. Sale prices of a home depend on not just the properties of the home, but also the individual buyer, seller, and even the time of year of the sale.
For example, a home that sold recently for $300k might, with a different seller and buyer, sell for $270k or $330k, despite being the same exact home. To be fair to all properties—those that have sold recently, and those that haven’t—the CCAO uses the same methods to estimate true market values.
Furthermore, setting the market value of a home equal to the value of a recent sale is called selective appraisal or sales chasing. Sales chasing can bias assessment accuracy in favor of recently sold properties, giving an unfair advantage to areas or properties with high turnover. Sales chasing can also artificially improve assessment performance statistics and bias statistical models. For more information, see Appendix E of the IAAO Standard on Ratio Studies.
More FAQs are here.
Appendix
Appendix 1: Neighborhood statistics
Every assessment township is divided further into Neighborhood Codes. You can find your home’s neighborhood code on its Reassessment Notice and on its PIN details.
We think it’s fair to allow homeowners to be able to compare our estimate of their home’s value with the real estate market. Below is a map of median sale prices in each Neighborhood Code (with a table of values below).

Some important notes:
Some neighborhoods are large, others are small. If there are 0 sales in a neighborhood, this does not mean that the model had no data. Our model used 7 years of sales throughout Chicago to estimate home values in a neighborhood. So, even if there were few or no sales in a neighborhood in 2020, we ensured that our model had plenty of data to estimate home values.
Neighborhood codes are just one way that the CCAO measures location. We also use the home’s road proximity, whether it’s on a floodplain, and elementary and high school district neighborhood boundaries.
| Neighborhood Code | # of condominium properties | Most common property class | # of sales in 2020 | Median sale price (2020) | Range of sale prices (min, max) |
|---|---|---|---|---|---|
| 011 | 12 | 299 | NA | NA | NA |
| 013 | 209 | 299 | 3 | $41,000 | $40,000, $163,000 |
| 020 | 178 | 299 | 11 | $155,000 | $40,000, $366,750 |
| 030 | 3739 | 299 | 296 | $399,000 | $139,800, $800,000 |
| 040 | 53 | 399 | 1 | $65,000 | $65,000, $65,000 |
| 051 | 1856 | 299 | 174 | $522,500 | $250,000, $855,000 |
| 052 | 785 | 299 | 76 | $456,250 | $219,900, $850,000 |
| 060 | 1773 | 299 | 107 | $485,000 | $218,000, $1,000,000 |
| 080 | 8 | 299 | NA | NA | NA |
| 085 | 4 | 299 | NA | NA | NA |
| 091 | 159 | 299 | 5 | $140,000 | $66,000, $251,000 |
| 101 | 53 | 299 | 4 | $256,000 | $226,500, $275,000 |
| 102 | 719 | 299 | 23 | $125,000 | $65,000, $275,000 |
| 103 | 494 | 299 | 32 | $231,250 | $164,850, $420,000 |
| 115 | 32 | 299 | NA | NA | NA |
| 120 | 5281 | 299 | 340 | $474,000 | $32,500, $1,430,000 |
| 131 | 14110 | 299 | 250 | $365,500 | $30,000, $1,570,000 |
| 132 | 2504 | 299 | 108 | $296,500 | $145,000, $680,000 |
| 141 | 697 | 299 | 39 | $307,500 | $132,000, $586,000 |
| 150 | 1401 | 299 | 113 | $365,000 | $165,000, $905,000 |
| 151 | 179 | 299 | 15 | $424,000 | $210,000, $585,000 |
| 152 | 493 | 299 | 35 | $520,000 | $260,000, $1,165,000 |
| 170 | 1828 | 299 | 93 | $485,000 | $208,550, $1,275,000 |
Class Descriptions
| Class Code | Class Description |
|---|---|
| 299 | Condominium |
| 399 | Rental condominium |
Appendix 2: Sales Ratio Study
In the 2021 reassessment of West Chicago the CCAO met 3 of 3 IAAO standards for high-quality assessments in a sales ratio study.
Sales ratios are the ratio between a property’s estimated value and its recent sale price. A sales ratio of 1.0 means that a property’s value was estimated to be precisely its sale price. A ratio of 0.9 indicates the estimated value was 90% of its sale price.
Below are the results of our sales ratio study, which measures three metrics based on sales ratios. We also compare 2021 to Assessor-final values in 2018.
Median sales ratio First, we calculate sales ratios of all homes in West Chicago that sold. A median is similar to an average: it’s the “middle” of all the sales ratios. The median ratio is a good way to check whether assessments generally tracked the market.
Desired range: 0.95 to 1.05
2018 result: 0.952
2021 result: 1.003

Uniformity: Assessment uniformity is measured using a statistic called Coefficient of Dispersion. This measures how far away a typical property’s ratio is from the median ratio. When most ratios are close to the median ratio, this means assessments are uniform. When ratios vary, such that some are significantly above and some are significantly below the median, this means assessments are non-uniform, therefore imprecise.
Desired range: 5 to 15
2021 result: 10.17 (CI: 9.8, 10.55). This met the IAAO standard.

Equity (Vertical Equity): Assessments should be equally precise for properties that sold for $100,000 and for those that sold for $1,000,000 (and all others, too). The IAAO measures assessment equity by analyzing whether sales ratios are systematically higher or lower based on properties’ sale prices. Equity is measured using two statistics: Price-Related Bias (PRB), and Price-Related Dispersion (PRD). If one of these statistical tests meet IAAO standards, assessments meet the IAAO standard on equity.
Desired ranges: PRD of 0.98 to 1.03, or PRB of -0.05 to 0.05
2021 PRD result: 1.01 (CI: 1, 1). This met the IAAO standard.
2021 PRB result: 0 (CI: 0, 0). This met the IAAO standard.


Appendix 3: Market Values vs. Assessed Value
After estimating the market value of a home, the Assessor’s Office calculates the home’s Assessed Value based on its Level of Assessment.
Levels of Assessment are set by Cook County Ordinance based on the property’s major class. Single-family homes, condos, and all other 200-class properties have a 10% Level of Assessment, so the property’s Assessed Value equals 10% of its estimated market value.
A home valued at $500,000 has an assessed value of $50,000.
Note that it is not the Assessed Value that is taxed. The taxable value of the home is its final Equalized Assessed Value. This requires two more numbers:
The Equalizer (also called the Multiplier), calculated every year by the Illinois Department of Revenue. All properties in Cook County have the same Equalizer. Equalized Assessed Value, or EAV = the Equalizer x Assessed Value. Example: with an Equalizer of 3.0, this home’s EAV = 3.0 x $50,000 = $150,000.
Any homestead exemptions, like the Homeowner Exemption or Senior Exemption. These subtract a fixed amount from the home’s EAV and is the same throughout Cook County. For example, the Homeowner Exemption subtracts $10,000 of EAV, and the Senior Exemption subtracts $8,000. Example: with the Homeowner and Senior exemption (both of which currently auto-renew), the home’s final EAV after exemptions = $150,000 - $10,000 - $8,000 = $132,000. This is the number to which the tax rate is applied to calculate a second installment property tax bill.
Appendix 4: Additional reading about Chicago’s Real Estate Market
- The Case-Shiller Index in Chicago shows home prices are up
- Home prices up at least 10 percent from last year in two-thirds of country (ATTOM Data Solutions, nationwide property database)
- Chicago-area home sales and prices are seeing double-digit gains. ‘There’s just so few homes and so many buyers.’ (The Chicago Tribune)
- The Pandemic Ignited a Housing Boom—but It’s Different From the Last One (The Wall Street Journal)
- Chicago-area home prices rose 7.7% in December, a dramatic gain but smallest among big cities (The Chicago Tribune)
- Home prices continue surge over 2019, while inventory remains low (The Chicago Tribune)